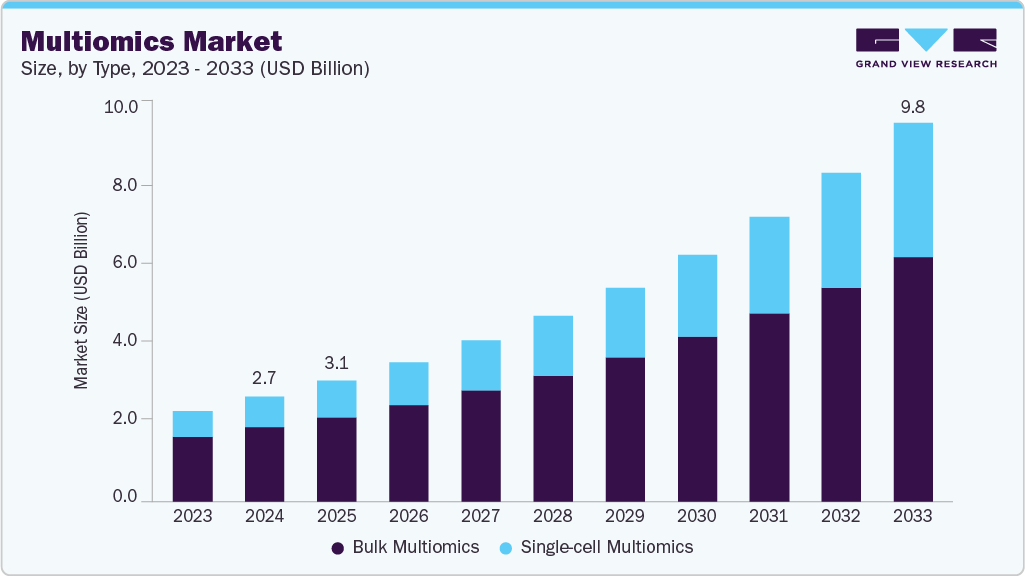
The multiomics sector is expanding due to rising investments, growing demand for personalized medicine, and rapid technological progress. This market is valued at USD 2.76 billion in 2024 and is projected to reach a value of USD 9.8 billion by 2033, with a CAGR of 15.32%. Moreover, in 2023, the NIH launched the Multiomics for Health and Disease Consortium, committing over US$50 million in funding to support innovation and collaboration in the field (BioSpace).
In recent years, this topic has attracted widespread interest among researchers. For example, the annual number of articles on multi-omics applications in drug discovery has increased nearly 40-fold in just 10 years (Wang et al., 2024).
Data representation plays a crucial role, as efficient organisation of large datasets enables proper analysis.
A knowledge graph is a representation method that is gaining increasing popularity in the healthcare and biotechnology fields. While in 2017 fewer than 10 papers on this topic were published per year, by 2021 the number had risen to around 120 (Budhdeo et al., 2025).
However, analization of multiomics data is still a complex task. To overcome limitations, scientists implement AI-powered tools. For example, GraphRAG models can potentially improve retrieval precision, contextual depth, consistency, and reliability of results (Xiang et al., 2025).
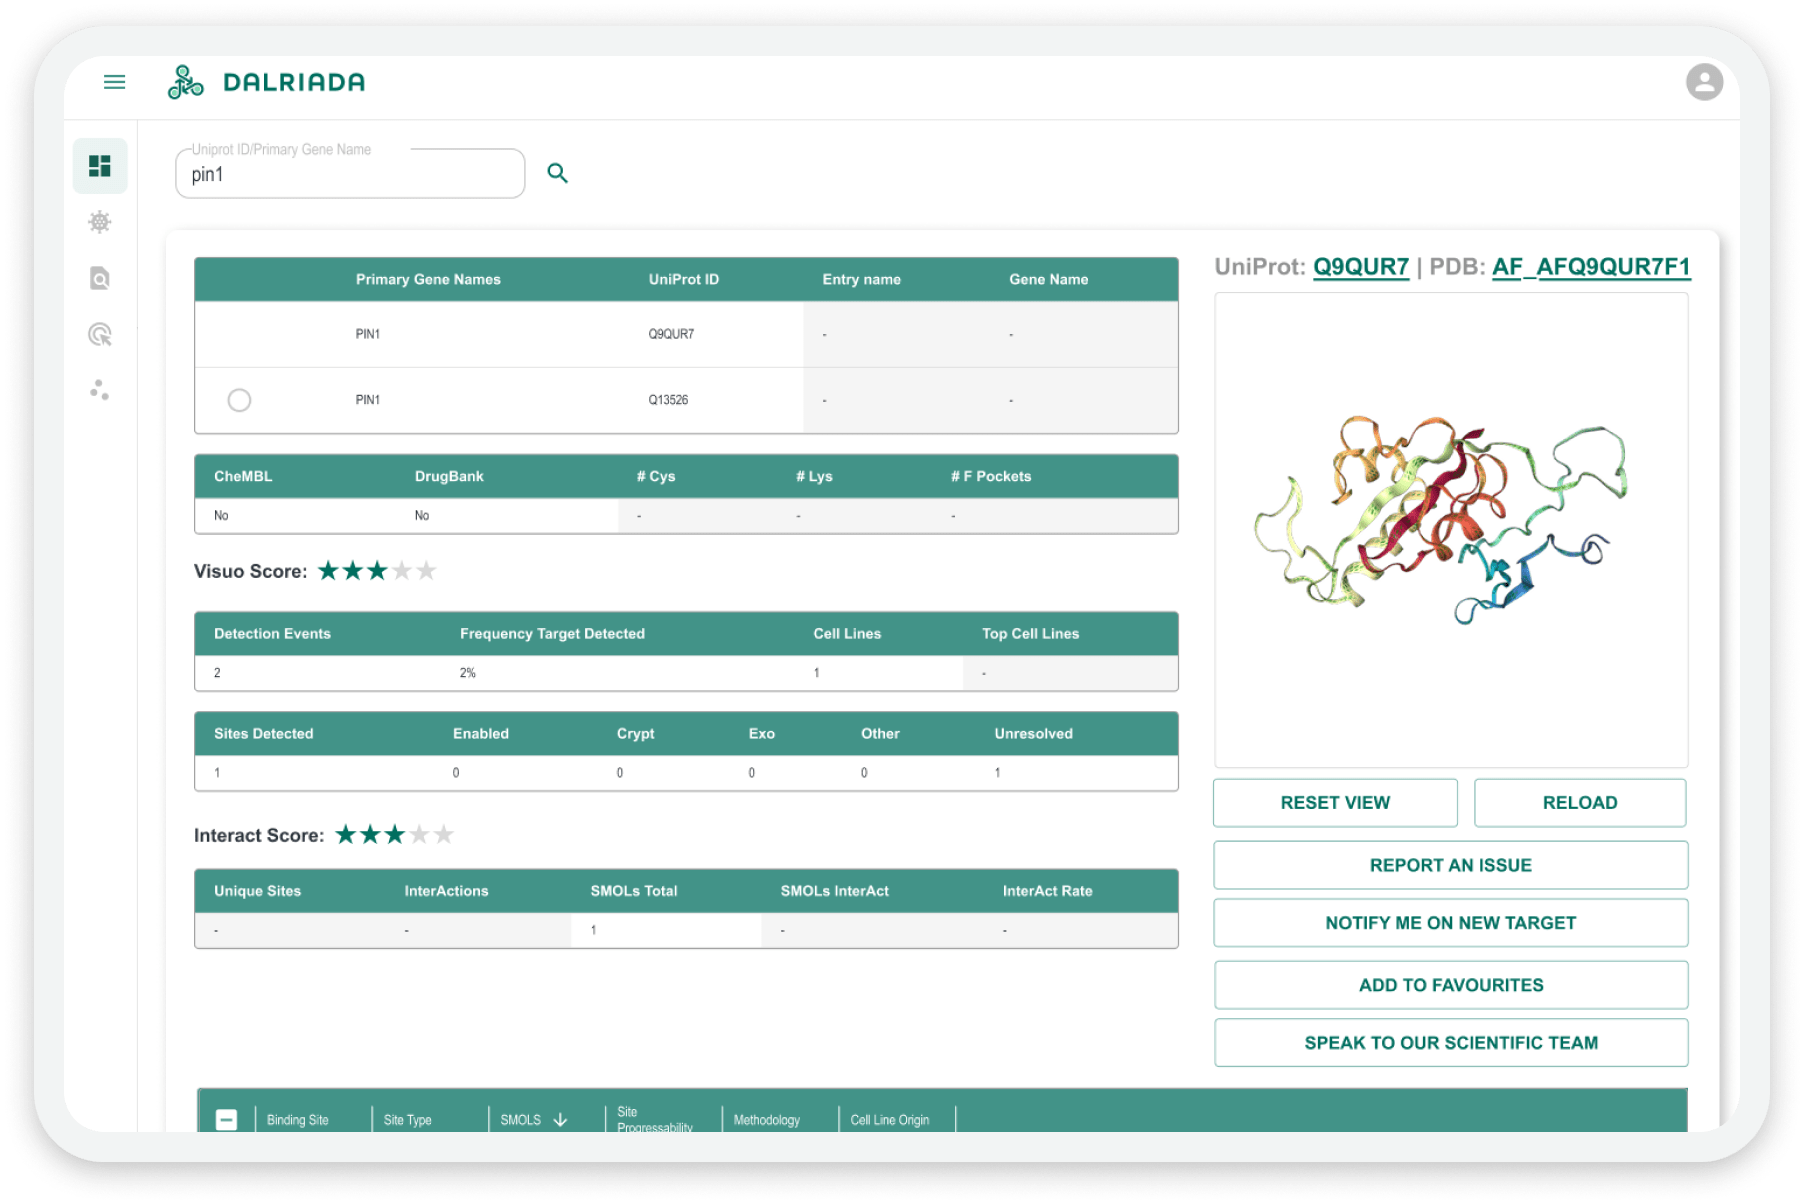
A practical example of this approach is shown in our AI-Generation of Drug Molecules case, where we built a generative model capable of producing novel, biologically relevant compounds directly from structured omics data – accelerating the early discovery cycle.
Explore the Full CaseMulti-Omics – What It Is and Why This Approach Matters
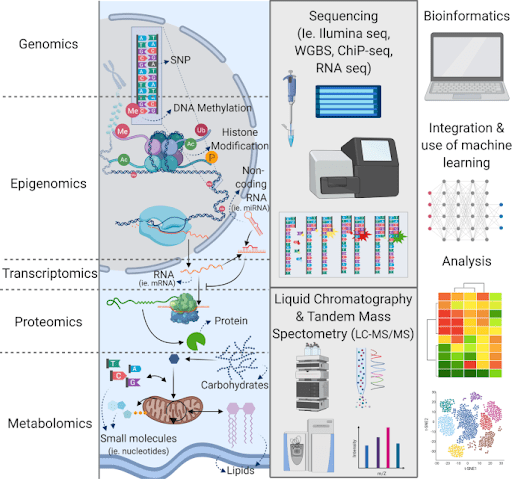
Multi-omics studies reveal interactions across biological layers, helping identify invisible in single-omics disease’s features. For instance, a disease phenotype might only be explained by combining DNA variants, methylation patterns, gene expression, and protein activity (Hayes et al., 2024).
Let’s consider the value of this approach using case studies.
Disease subtyping and classification
Because of heterogeneity, it’s important to identify the subtypes of a disease or classify samples into subgroups to understand the etiology of the disease and select effective treatments for patients. And sometimes different diseases have hidden similarities, which can be useful for understanding their mechanism or repurposing existing drugs.
In one case study, iClusterPlus identified 12 distinct clusters by combining profiles of 729 cancer cell lines of 23 tumor types from CCLE. Naturally, many cell lines were grouped by their cell-of-origin; however, several other subgroups were possibly created by a mutual genetic alteration. For example, one cluster belonged to NSCLC and pancreatic cancer cell lines linked because of the detection of KRAS mutations (Subramanian et al., 2020).
Personalized medicines
Researchers identified personalized driver genes to understand the impact of tumor-mutated alleles on the functional activity of the protein. They find 5 driver genes with the investigation of:
- Near-saturation of the number of significantly mutated genes;
- Impact of mutation at the mRNA/protein level;
- Role of the genes in cancer development (Subramanian et al., 2020).
Clinical assessment predictions
Another study created a predictive model of treatment outcomes for depressive disorders with complex phenotypes, based on a combination of mutation data and metabolomics with clinical observations. Additionally, it identified sex depended differences in response to antidepressants(Subramanian et al., 2020).
Risk prediction and clinical outcome
Another research team integrated gene expression, miRNA expression, copy number alteration, and DNA methylation data into the multivariate Cox Lasso model. It identified 156 features that helped in the prediction of time to recurrence and survival in serous ovarian cancer. The integrated features provided better prediction than individual data sets (Subramanian et al., 2020).
Disease biomarkers and targets identification, drug development and repurposing
Multi-omics has shown advantages in biomarker prediction for many diseases (cancer, stroke, obesity, cardiovascular diseases, COVID-19…).
A combination of various omics information has great potential to guide targeted therapy. For example, a single chemical proteomics strategy can obtain 14 possible targets; however, only the simultaneous combination of targeted metabolomics enabled the identification of acetyl-CoA carboxylase 1 and acetyl-CoA carboxylase 2 as correct PFOC binding targets (Chen et al., 2023).
The integration of multi-omics data also accelerates the drug development process:
- Improve therapeutic strategies, patient outcomes;
- Useful in predicting drug sensitivity;
- Repurposing of existing drugs (uncovering new MOA, potential synergies with other treatments) (Wang et al., 2024).

Unlock the full potential of your biomedical datasets with a consultation from Ivan Izonin, PhD, Scientific Advisor in Artificial Intelligence at Blackthorn AI. Learn how advanced AI methods can transform multi-omics data into AI-ready assets and accelerate discovery through intelligent data modeling and analytics.
Book a ConsultationTop Challenges in Multi-Omics Analysis
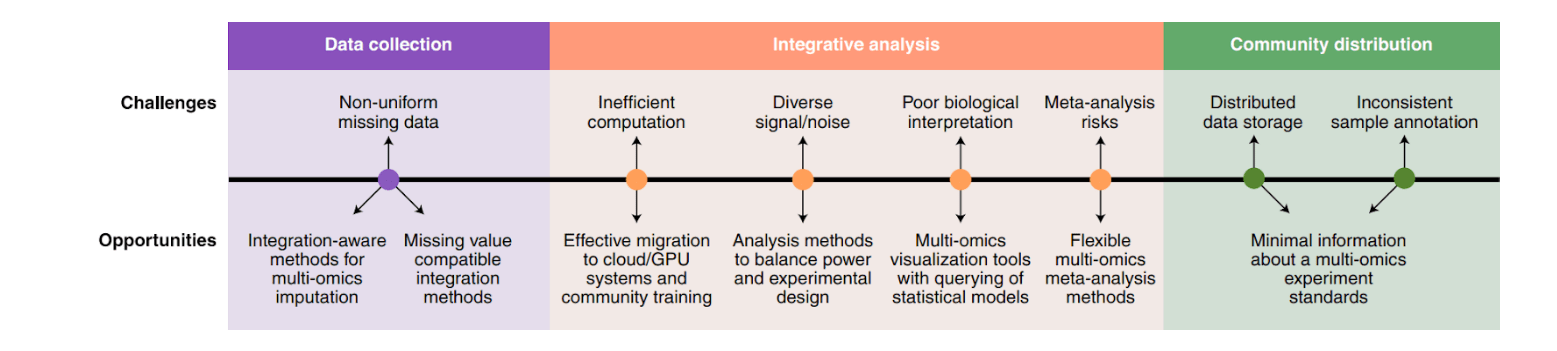
Data heterogeneity and complexity:
- Omics technologies have different precision levels and the signal-to-noise ratio that affect statistical power (ChIP-seq is less sensitive than RNA-seq > mismatches between gene expression and chromatin modifications);
- Differences in experimental protocols, sample types, and analytical platforms;
- Difficult to interpretate cause-and-effect relationships and accurately predict system behavior;
- Complex preprocessing: normalization, missing values, batch effects, outliers, sparse or low-variance features, multicollinearity, and artifacts (Chen et al., 2023; Hayes et al., 2024; Mukherjee et al., 2025).
Scalability and storage:
- High storage and processing needs;
- Most existing analysis pipelines were built for smaller datasets;
- Limited parallelism of CPUs without specialized accelerators;
- Local HPC clusters often lack scalability, cloud platforms provide elasticity but increase costs;
- Different omics types have distinct formats (SNP data contains 0, 1, or 2, while the value of copy number data may consist of −2, −1, 0, 1, or 2);
- Most data are stored in omics-type–specific databases, and only hyperlinks connect them (Tarazona et al., 2021; Chen et al., 2023).
Integration and interoperability between datasets:
- Ignores that many effects are specific to a particular layer > misleading conclusions;
- Statistical power imbalance: collecting equal numbers of samples > different power across omics; matching statistical power > unequal sample counts across omics;
- Incomplete data at some of the omics levels, QC filtering further reduces the number of relevant samples;
- Imputing missing samples violates independence assumptions and biases downstream analyses;
- Many integration methods can only operate on a few types of omics layers;
- Assembling datasets is manual, time-consuming, and often incomplete(Canzler et al., 2020; Tarazona et al., 2021).
Data interpretation and extracting actionable insights:
- Many correlated or redundant variables, complicating feature selection and interpretation;
- Requires new visualization and interpretation approaches;
- Adding more omics layers can obscure the true biological signal;
- Thousands of statistical tests without predefined hypotheses create a high false-positive rate;
- Struggles with analyzing spatial and temporal variations (Hayes et al., 2024; Mukherjee et al., 2025; Yetgin, 2025).
Reproducibility and standardization:
- Many results fail replication;
- Practices like HARKing (hypothesizing after results are known) undermine reproducibility;
- Users cannot always track software/database versions or parameter settings that influence results;
- Neglecting of reproducibility best practices (code–data linkage or the “ten simple rules”);
- Methods must be tailored to each dataset, and analytical goals need to be planned before data collection (Hayes et al., 2024; Canzler et al., 2025).
How Knowledge Graph + Graph RAG Help Structure Multi-Omics Data:
Unlike a baseline RAG (a technique that connects external data sources) that uses a vector database to retrieve semantically similar text, GraphRAG implements knowledge graphs, which consist of a graph of nodes (entities or concepts) and edges (relationships between them) (Budhdeo et al., 2025). In a biological context, nodes can represent genes, proteins, metabolites, diseases, or drugs, while edges represent biological or clinical relationships (protein-protein interactions, gene-disease associations, metabolic pathways).
GraphRAG enables AI systems to make sense of large, heterogeneous, and interconnected datasets by combining retrieval with structured graph representations:
- Converts unstructured and multi-modal data into knowledge graphs > relationships between entities are explicit and easier to retrieve (required between 26% and 97% fewer tokens than alternative approaches);
- Retrieves documents with structured graph evidence > more accurate and relevant responses (improved by 3x);
- Anchoring outputs in verified graph-based knowledge > reduces hallucinations;
- Enables transparent reasoning chains (Edge et al., 2025; Data.world; Digital Alpha Platforms).
Such properties enable overcoming key limitations of multi-omics research
Integration
GraphRAG allows datasets and literature to be jointly embedded in the same retrieval space. By incorporating quantitative attributes (z-scores, safety scores…) directly into graph nodes, this approach enables seamless cross-validation of candidates across data types (Wandy et al., 2021; Wu et al., 2024; Sekar et al., 2025).
Scalability
The knowledge graph is divided into communities (by tissue, cancer type, or gene family), represented by summaries. At query time, only the relevant subgraphs and summaries are retrieved, reducing token load and avoiding the need to process all raw data. Moreover, new omics datasets or publications can be appended as new nodes and edges without retraining the entire model (Edge et al., 2024).
Semantic Search
GraphRAG enhances retrieval by combining entity-aware graph traversal with semantic embeddings. For example, it enables connecting genes to pathways, clinical trials, and drug targets, which is difficult to achieve with text-only retrieval (Wu et al., 2024; Sekar et al., 2025).
Interpretation
Outputs linked directly to the supporting subgraph. The model returns evidence tables and safety scores, shows how entities are connected, avoiding “black-box” answers (Wandy et al., 2021; Wu et al., 2024; Sekar et al., 2025).
Also, it’s important to understand that making data AI-ready is essential as it enhances model accuracy, reduces errors and biases, improves the reliability, speeds up analysis, and insight generation. Moreover, harmonized datasets support scalability, allowing seamless integration across studies and institutions (Elucidata, 2025).
Case Studies – Enhancing Multi-Omics Outcomes with AI
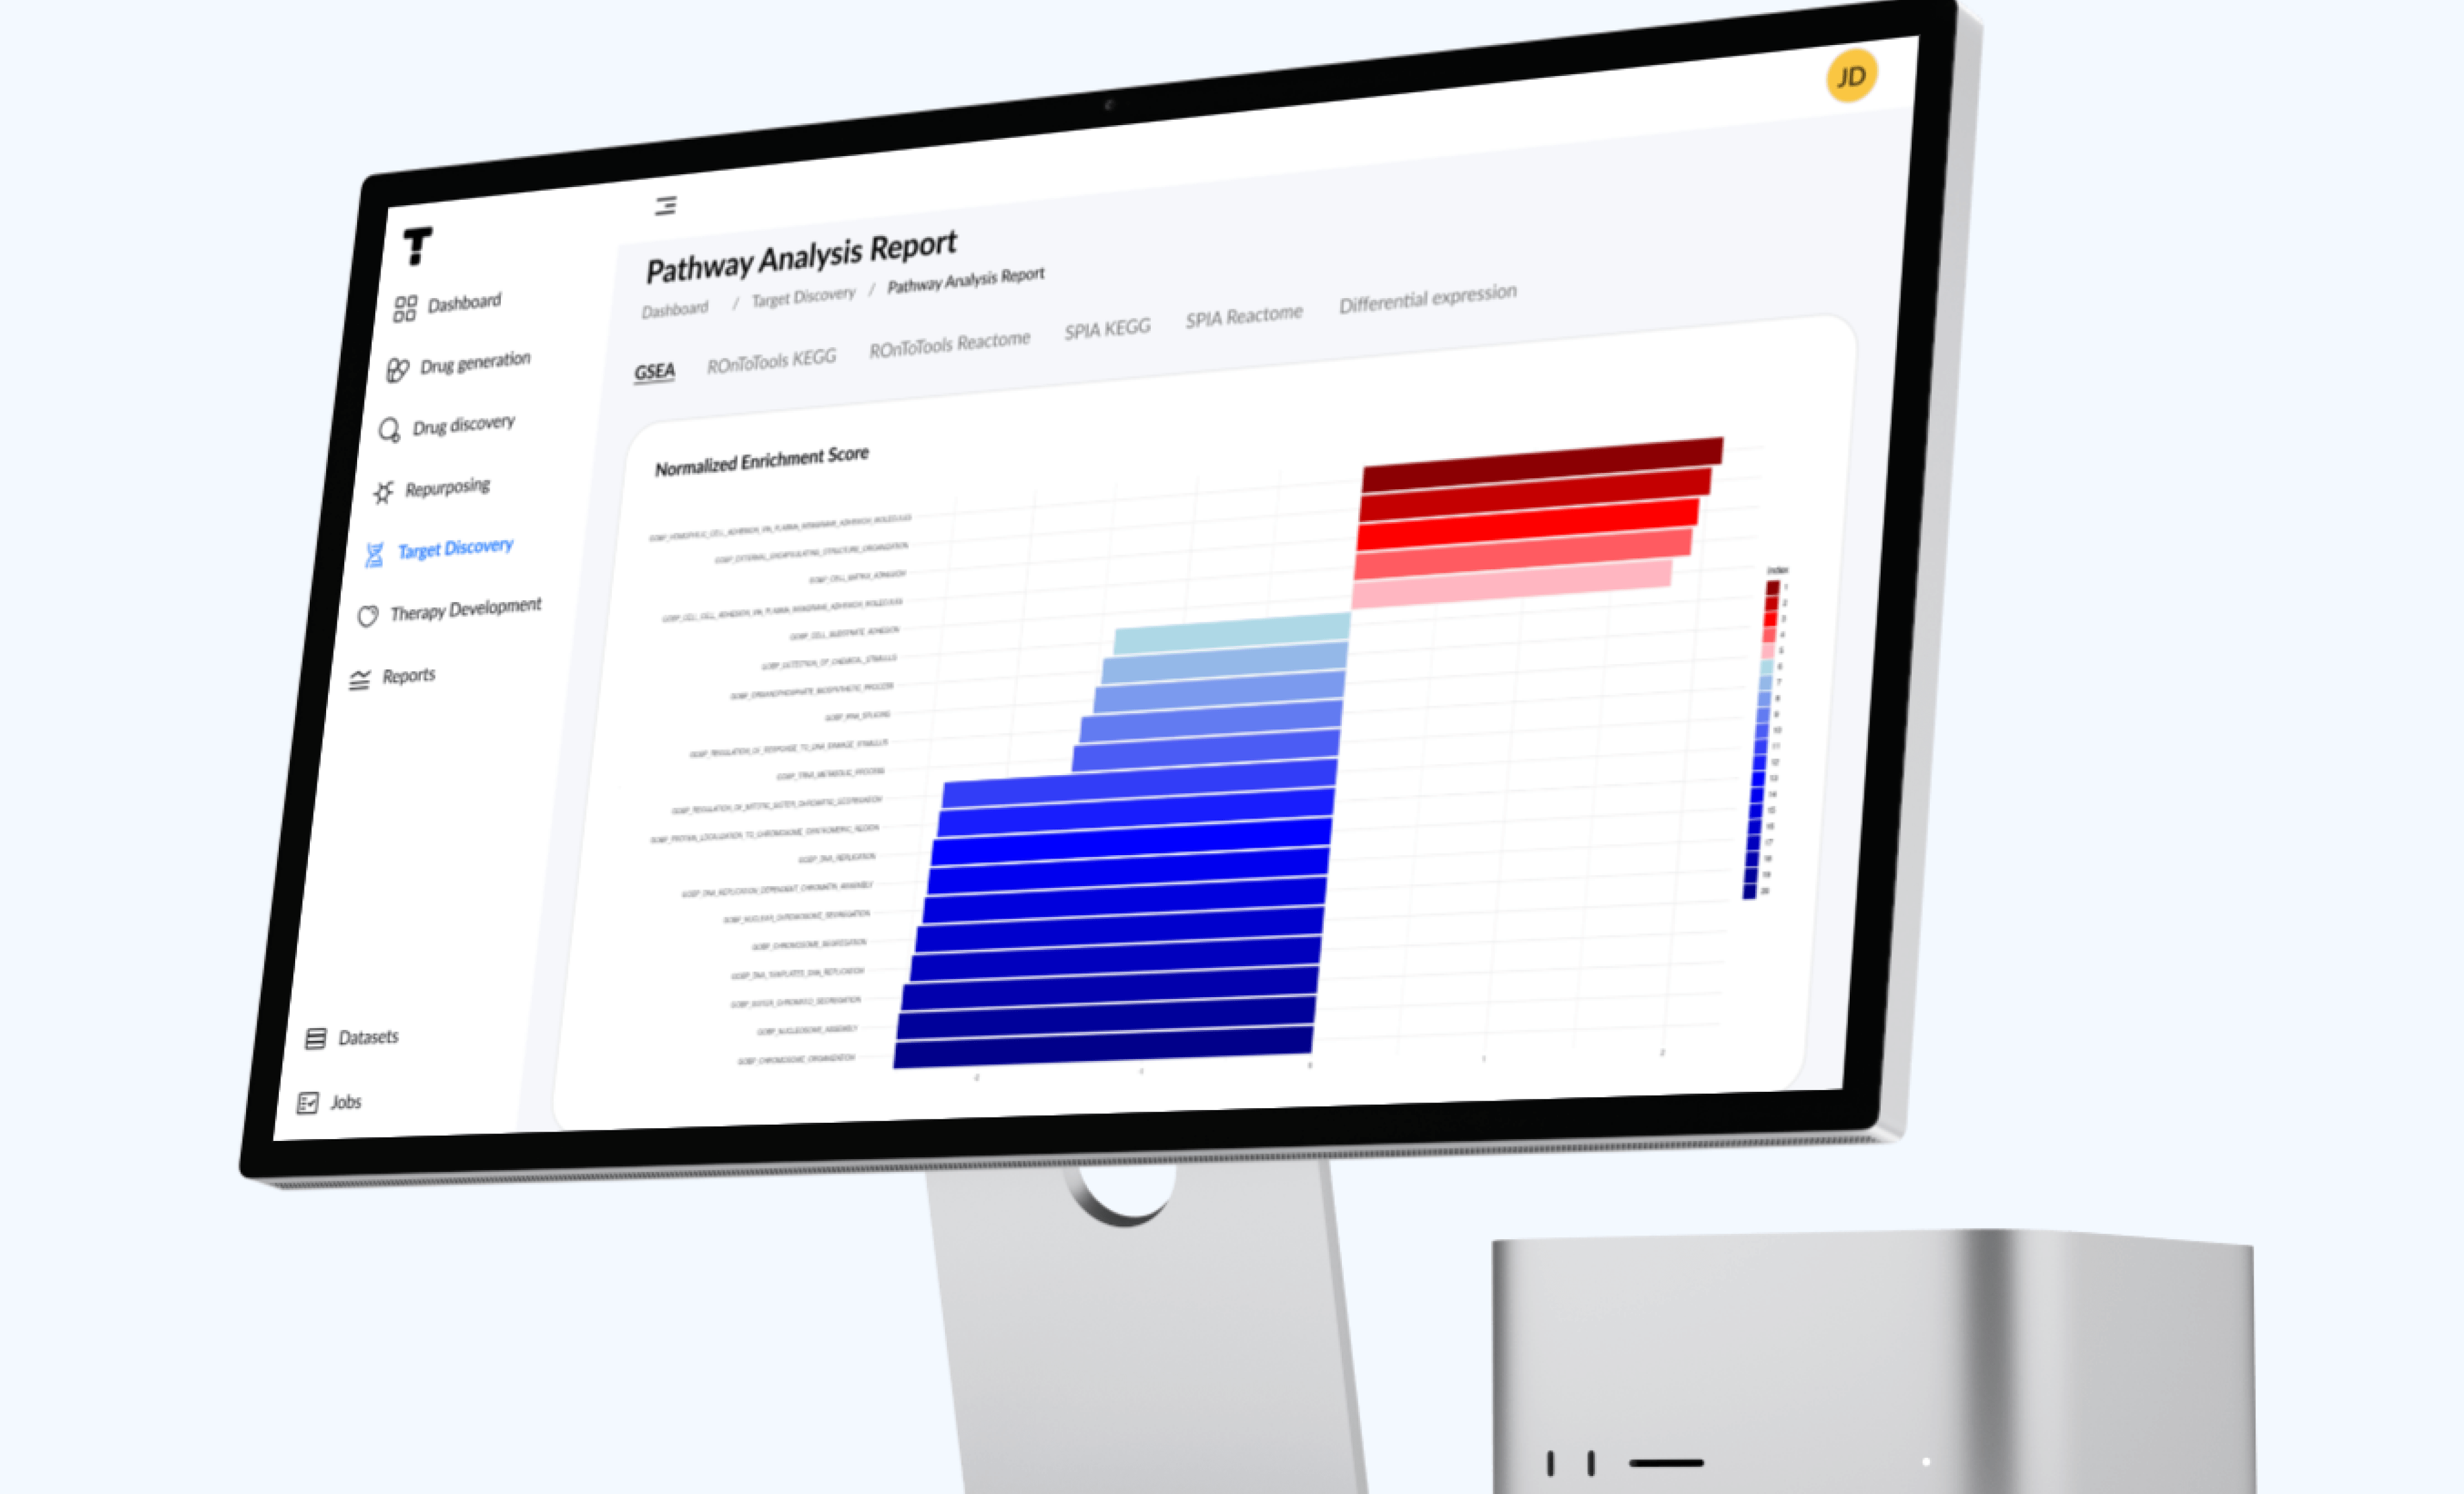
Multi-omics AI data platform
This approach enables indication, target discovery, and repurposing, along with generating new drug candidates with specific physicochemical and biological properties, including logP, logS, pKa, BBBP, binding affinity, metabolic stability, and toxicity.
In one of the case studies, the team achieved:
- Out of 300 molecules screened, 23 candidates were found with IC50 values lower than the reference compound;
- 90% reduction in unnecessary synthesis of drug candidates;
- 80% cost reduction in early-stage drug discovery.
Multi-Omics Data Warehouse
As discussed previously, data storage and processing are key questions in multiomics research.
The system created by our team harmonized multi-omics data from multiple sources into a centralized data warehouse, eliminated manual toil through data processing and storage automation, and enabled real-time data interaction through dashboards and visualizations.
As a result:
- 40% cost reduction;
- 38% faster time from data entry to report generation;
- 86% automated data processing;
- 95% reduction in data processing errors.
In Case Studies section of our website, you can find more information about these projects and view others.
Conclusion
Multi-omics is a promising source of previously hidden biological insights. However, accessing them is not a simple task.
GraphRAG enhances these approaches by converting unstructured and multi-modal data into knowledge graphs, capturing entity relationships, retrieving data with structured graph evidence, and enabling more accurate and relevant responses.
Despite promising AI-powered tools, multiomics data often isn’t ready for integration.
It’s important to harmonize, validate, and ensure the interoperability of datasets, as high-quality data:
- Reduces errors and biases;
- Speeds up analysis and decision-making;
- Enables the combination of research results and the work of different institutions.
So the future of multi-omics significantly depends on collaboration between scientists to address the lack of standardized approaches for data collection, storage, organization, and integration, as well as for developing effective and reliable processing methods using AI-enabled tools.