- Customer Stories
- /
- Parking Space Segmentation for Cars and Bikes
Parking Space Segmentation for Cars and Bikes
Camera-based parking occupancy detection for car parks and two-tier bike racks, moved to instance segmentation that runs on Intel servers without GPUs.
Per-space F1 for cars, 7 car parks
Average per-space F1 for bikes in two-tier racks
For 90 camera frames on one CPU server
Abel Sensors supplies smart parking technology for cars and bicycles: cameras and sensors that measure occupancy, and parking guidance signs that direct people to free spaces.
Working with Abel Sensors’ R&D team, Blackthorn AI brought instance segmentation to its camera-based parking space detection, without adding GPUs on site. The work ran as two tracks. The car model went first, delivered as a tested Python inference module for Abel Sensors’ first production site. The bike track took longer, because bikes needed hand-drawn masks and more training.
Industrial & Inspection
Industry
Computer Vision, Edge AI, MLOps, Data Annotation
Services
Delft, Netherlands
Location
Computer vision · CPU inference
Engagement
Parking occupancy detection that copes with crowded bike racks, without GPUs
Most camera-based systems judge each parking space on its own: one polygon on the camera image, classified as occupied or free. Cars, each in its own bay, are the easy case. Two-tier bike racks are much harder. One camera watches 20 or more spaces, and bikes overlap, lean into the next space or hide behind baskets and coats. The new approach had to match or beat the current accuracy on the Intel servers already on site, with one inference pass per camera frame and no GPU. A batch of 90 frames had to finish within 10 seconds, and the output had to feed the existing occupancy logic and reporting unchanged.
Mask-based parking space occupancy detection on Intel CPUs
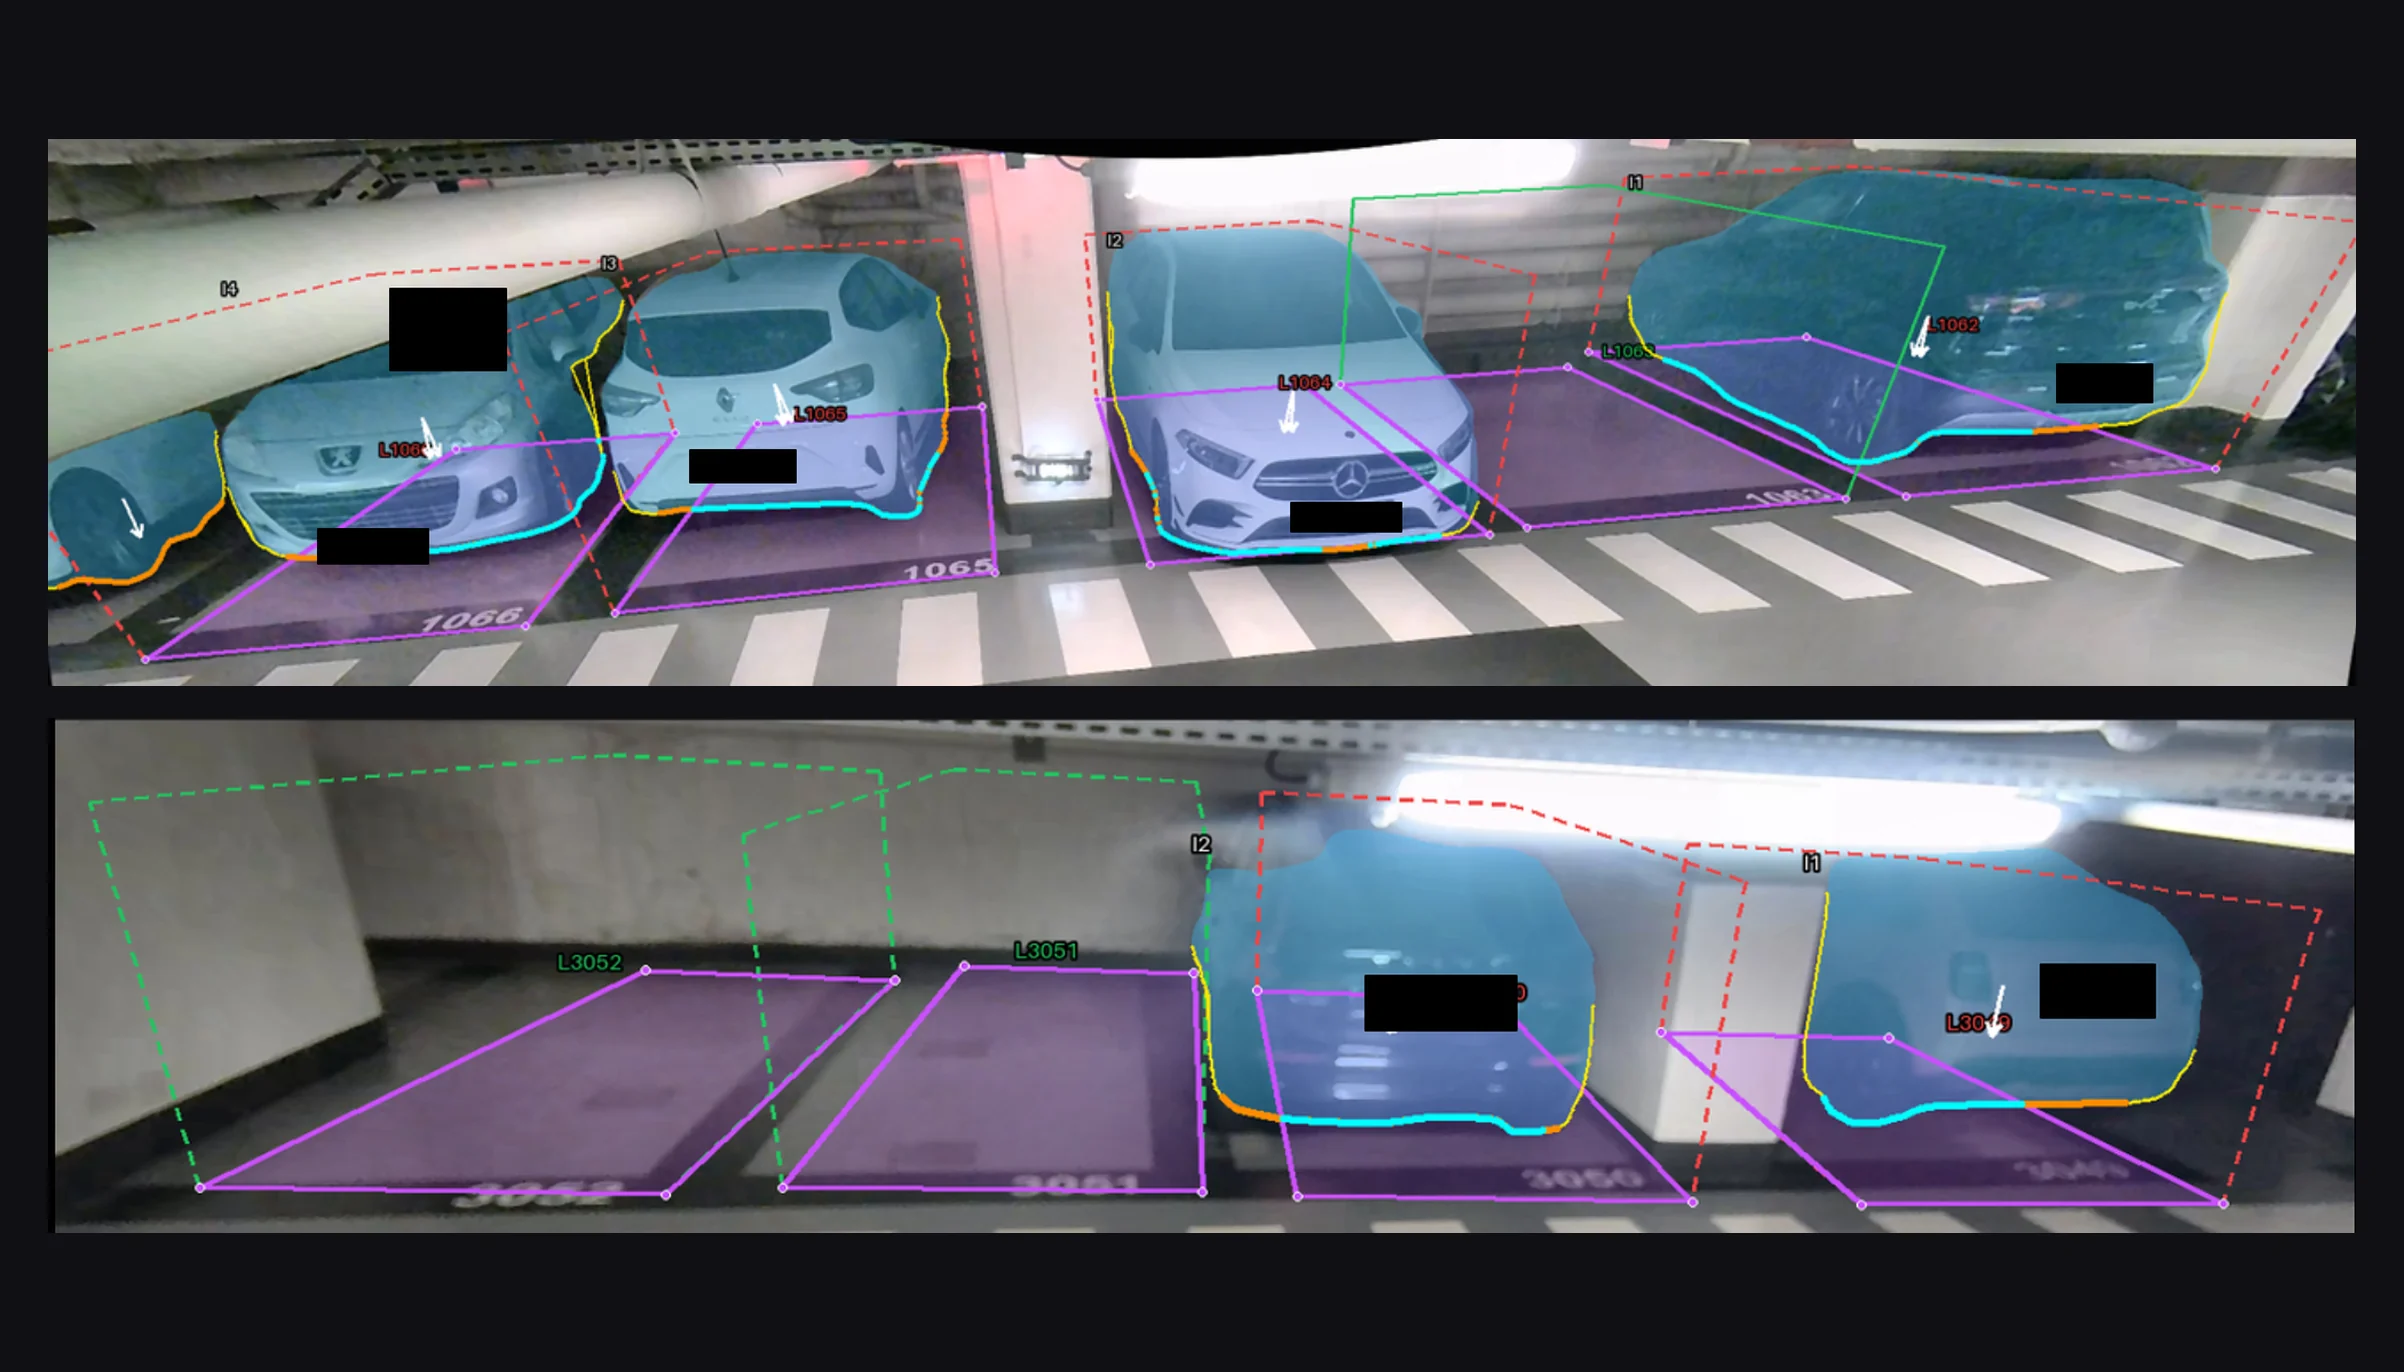
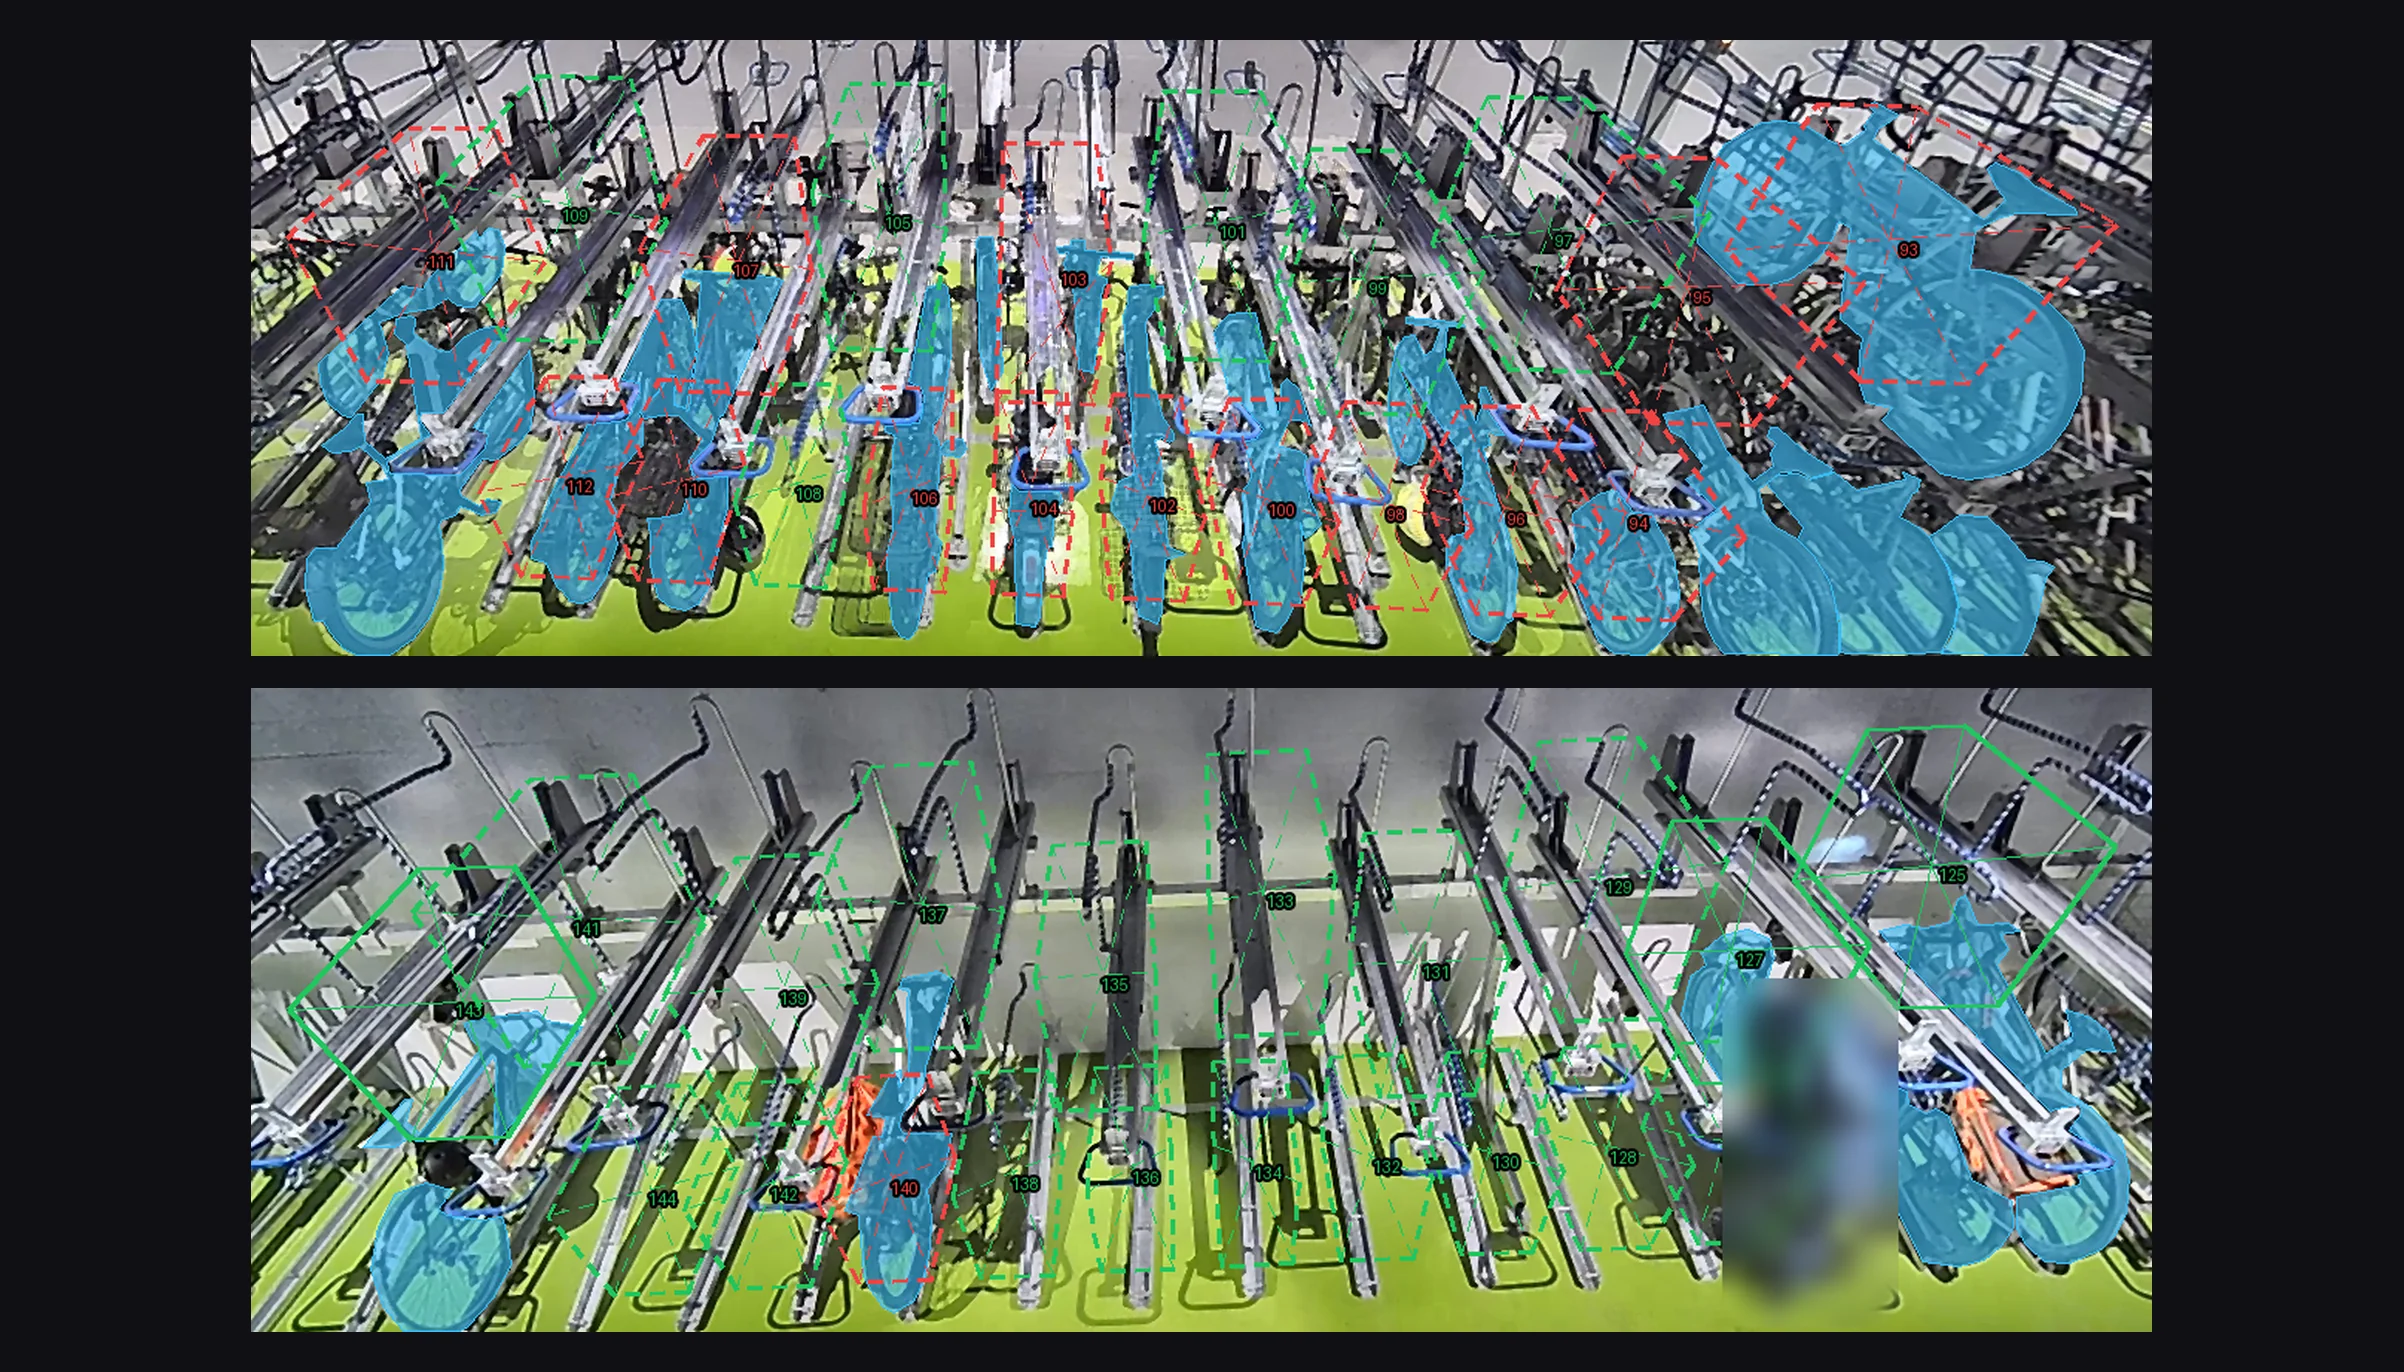
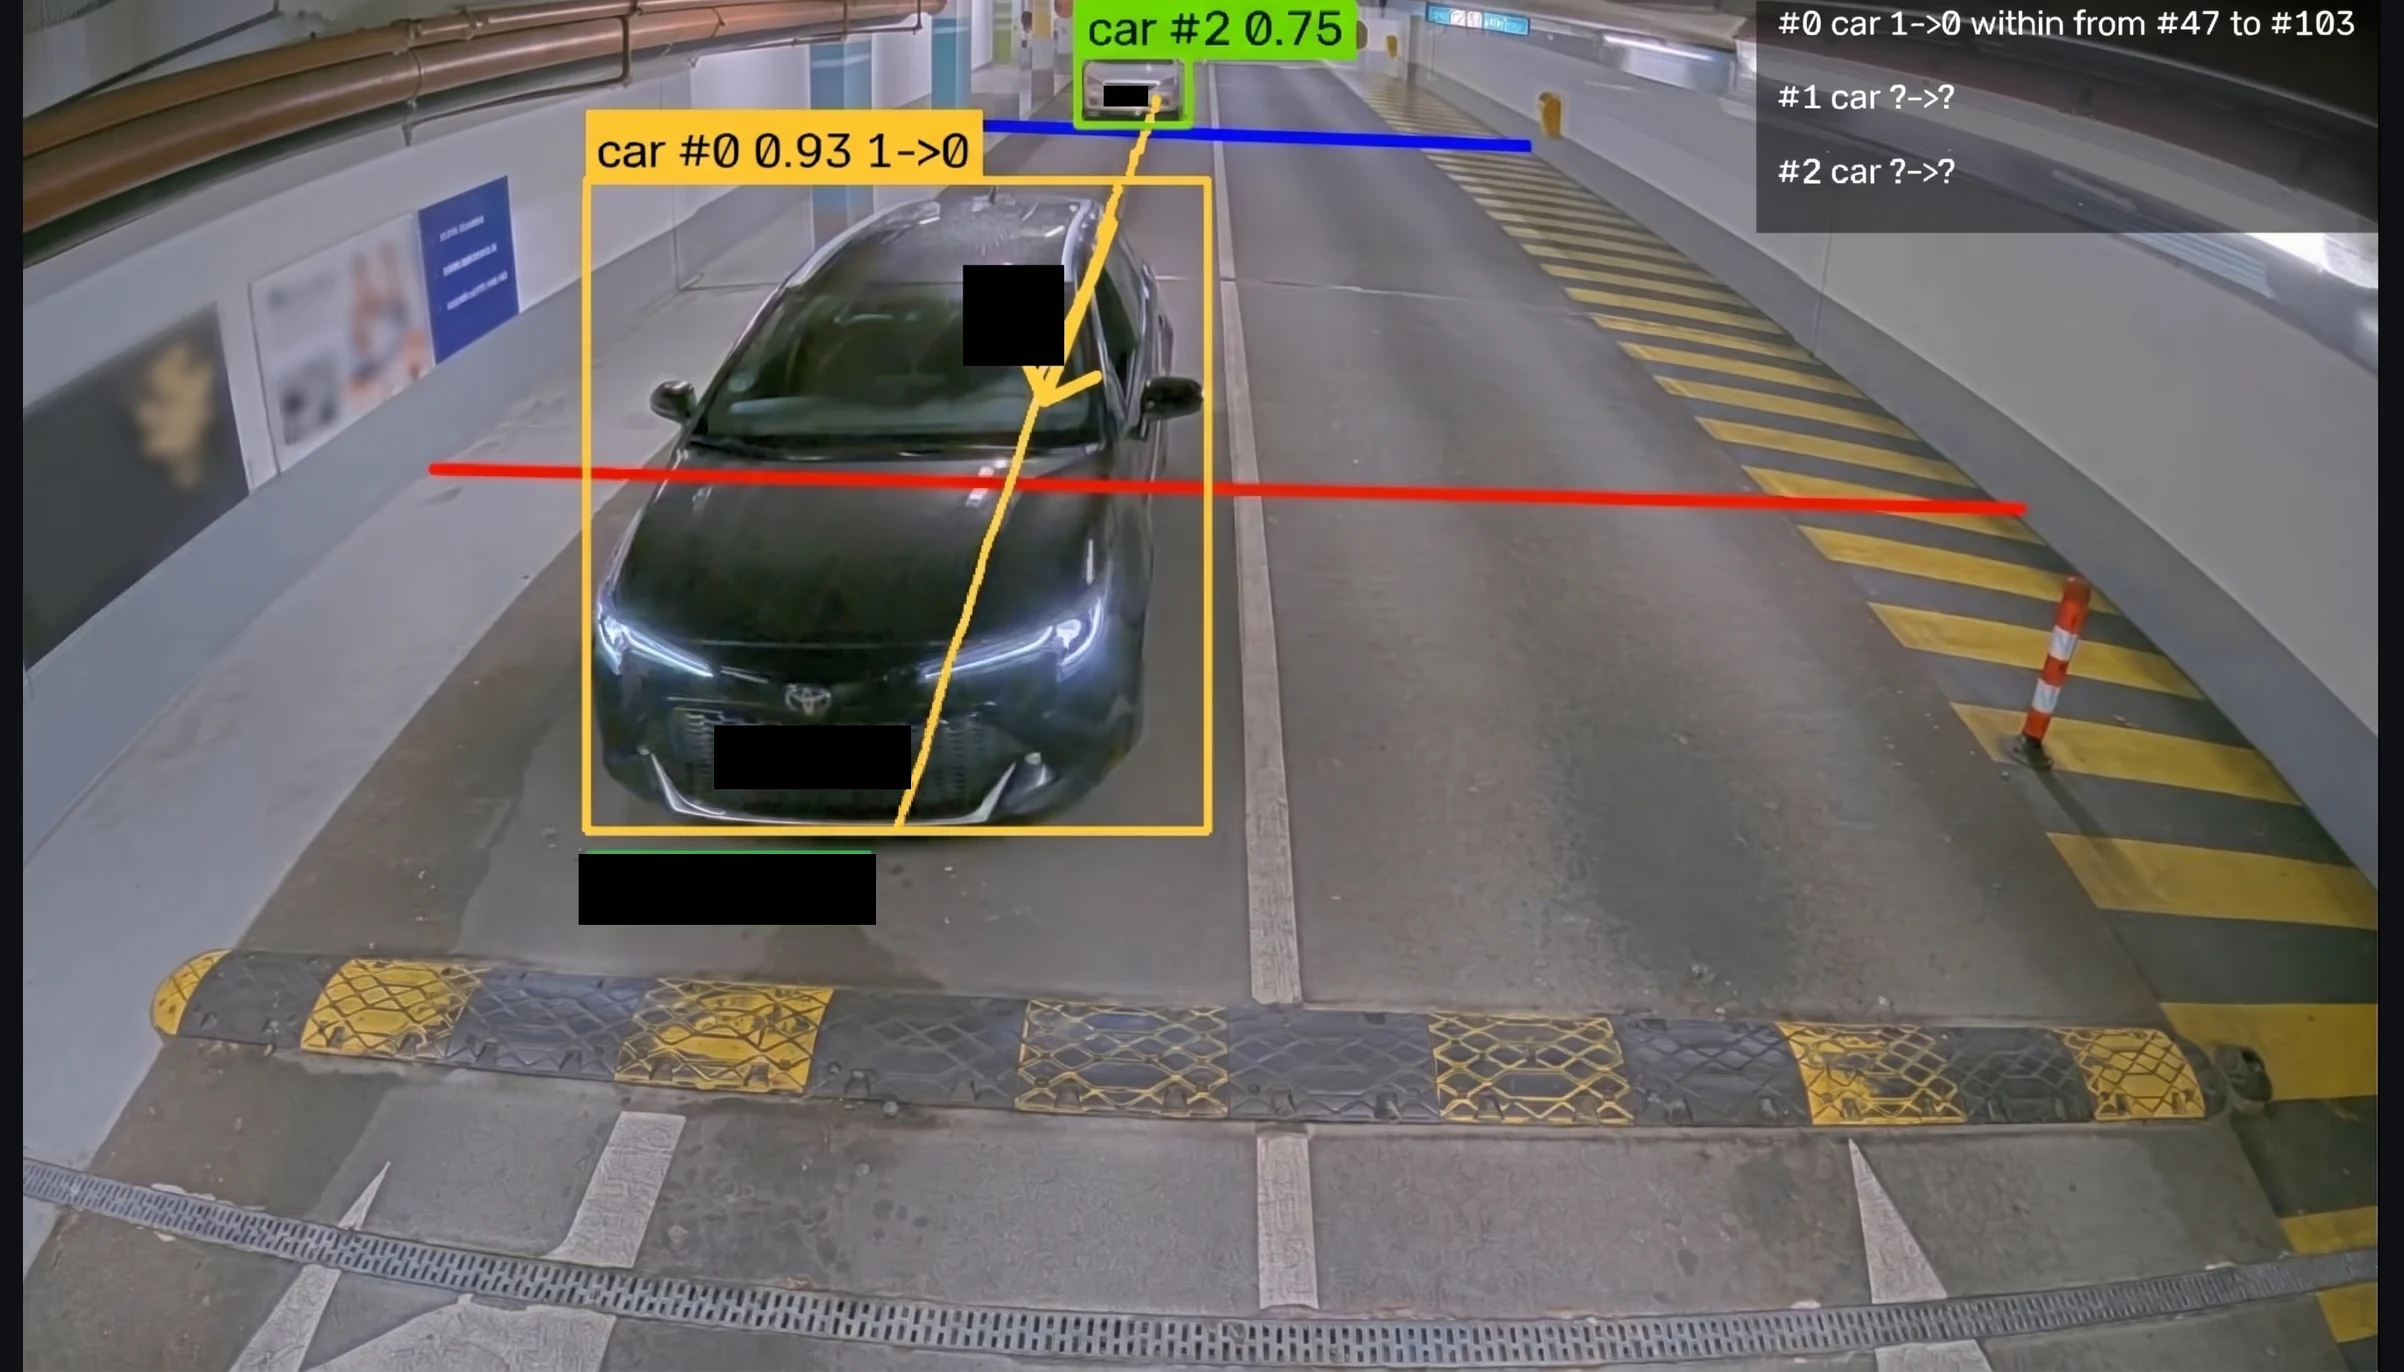
Together with Abel Sensors’ R&D team, Blackthorn AI added a segmentation step. The model reads the whole camera frame in one pass and outlines each car and bike it finds as a mask. The share of each space’s polygon that those masks cover decides whether the space is occupied. RF-DETR was chosen after it was fine-tuned and benchmarked against YOLO26 on production-class servers, then exported to Intel OpenVINO and quantised. On lane cameras, detected cars are tracked from frame to frame as they cross two counting lines. A change detector compares each frame with the last stable one, so a space changes state only when the change persists.
Custom AI Models Built with Python and PyTorch
RF-DETR instance segmentation, quantised with Intel OpenVINO for Intel CPUs, OpenCV and NumPy for the occupancy geometry, MLflow and DVC for model and data versions, and uv for reproducible environments.






Project duration
Six phases, from a CPU feasibility test to per-site rollout checks.
Team Size


What the Occupancy Upgrade Delivered
The F1 figures are per-space occupancy decisions from the final car and bike models; the car figure is pooled over 139 test images from seven car parks. Latency was measured on production-class Intel servers with no GPU.
99.7%
Per-space F1 for carsOn 139 held-out test images from seven car parks, the car model decided whether each bay was occupied or free with a per-space F1 of 99.7%. Cars are the easier track: automatic labelling works well and the models train quickly, so cars went to production first.
82%
Average per-space F1 for bikesBikes in two-tier racks are the hardest case: thin frames, overlaps between the rows and baskets or coats that hide part of the bike. The bike model reaches an average per-space F1 of 82%.
<10 s
For a batch of 90 camera framesRF-DETR-m processed a batch of 90 frames in about 9.9 seconds on an Intel Xeon server without a GPU, inside the 10-second budget for each batch.
AI parking space detection, also called parking spot detection, uses a camera and a computer vision model to decide whether each marked space is free or occupied. Each space is drawn once as a polygon on the camera image. In the approach Blackthorn AI developed with Abel Sensors’ R&D team, a segmentation model reads the whole frame in one pass and outlines each car and bike. When those outlines cover enough of a polygon, the space counts as occupied, and a change detector waits until the new state is stable before updating it.
It depends on the site, and Abel Sensors supplies both. An in-ground sensor watches one car bay, while one overhead camera covers several bays or 20 or more bike spaces, so cameras need far less hardware per space. The cost moves into software: the model has to cope with poor lighting, vehicles that overlap and objects that hide part of a space. For more on the lighting problem, see our study of deep learning detection under low-light conditions.
Because segmentation measures how much of each space an object actually covers. A per-space classifier gives each polygon its own occupied-or-free label from the pixels inside it. Segmentation first outlines every car or bike in the whole frame, then measures its share of each space it touches, so the occupancy rules can reason about whole objects: a bike already counted in the bottom row of a rack cannot also fill the space above it. With this approach the final models reach a per-space F1 of 99.7% for cars and an average of 82% for bikes.
Yes, if the model size fits the hardware. Exported to Intel OpenVINO, RF-DETR-m processed a batch of 90 camera frames in about 9.9 seconds on an Intel Xeon server with no GPU, inside a 10-second budget; YOLO26-m did the same batch in about 6.1 seconds. Very small edge computers may need an NPU accelerator, with the model quantised to INT8. For a deployment on an NXP NPU, see our edge AI food quality control case study.
For this project, RF-DETR. In the bike test both reached similar occupancy accuracy after fine-tuning, and in Roboflow’s published COCO benchmark their medium segmentation models are close too (mask AP 45.3 for RF-DETR-Seg-M, 44.0 for YOLO26-M-Seg). YOLO26 is faster on a CPU: on an Intel Xeon server a batch of 90 frames took YOLO26-m about 6.1 seconds and RF-DETR-m about 9.9 seconds. But YOLO26 is released under AGPL-3.0, so a closed commercial product needs a paid Ultralytics licence, while RF-DETR-Seg is Apache 2.0 and still fits the 10-second budget. For when compact vision models beat larger AI systems, see old-school computer vision vs AI agents.
A camera above the racks outlines each bike as a mask, and each bike space has its own polygon, with the top and bottom rows of the rack drawn separately. A space counts as occupied when bike masks cover a set share of it, tuned separately for bikes and cars. The hard cases are bikes in the bottom row that overlap top-row spaces, bikes that lean into the next space, baskets and coats that hide part of the bike, and bikes parked nearly edge-on to the camera. Some are handled with extra filtering, such as not letting one bike fill both rows at once; the rest need more labelled examples.
Far more for bikes than for cars. In our experience, a bike model with good accuracy needs a few hundred precisely labelled images, several thousand bikes in total. Cars need much less work: automatic labelling works well, and a reviewer spends about 20 seconds per car. Bikes are labelled by hand, at about 3.5 minutes each, because automatic segmentation tools miss the edges of thin frames and wheels.