Multi-Omics AI Pipelines & Bioinformatics Automation
Close the gap between raw biological data and actionable insights with scalable pipelines, clean data flows, and AI-powered analysis.




Accelerate scientific discovery with AI-powered knowledge graphs and Graph-RAG systems
Learn moreAI Models for Multi-Omics Analysis

ML/LLM models trained to detect signals across noisy datasets: biomarker discovery, patient stratification, pathway activation, functional predictions, early target selection.
Automated Multi-Omics Data Ingestion

Standardized ingestion for sequencing, proteomics, metabolomics, imaging, functional assays, structural biology, and clinical metadata – with automated QC and schema alignment.
Reproducible Bioinformatics Pipelines
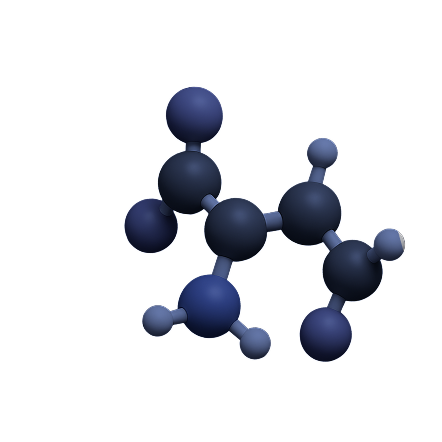
Version-controlled analysis pipelines for RNA-seq, scRNA-seq, bulk RNA, mass-spec proteomics, metabolomics profiling, variant calling, ATAC-seq, and more.
Multi-Omics Data Harmonization
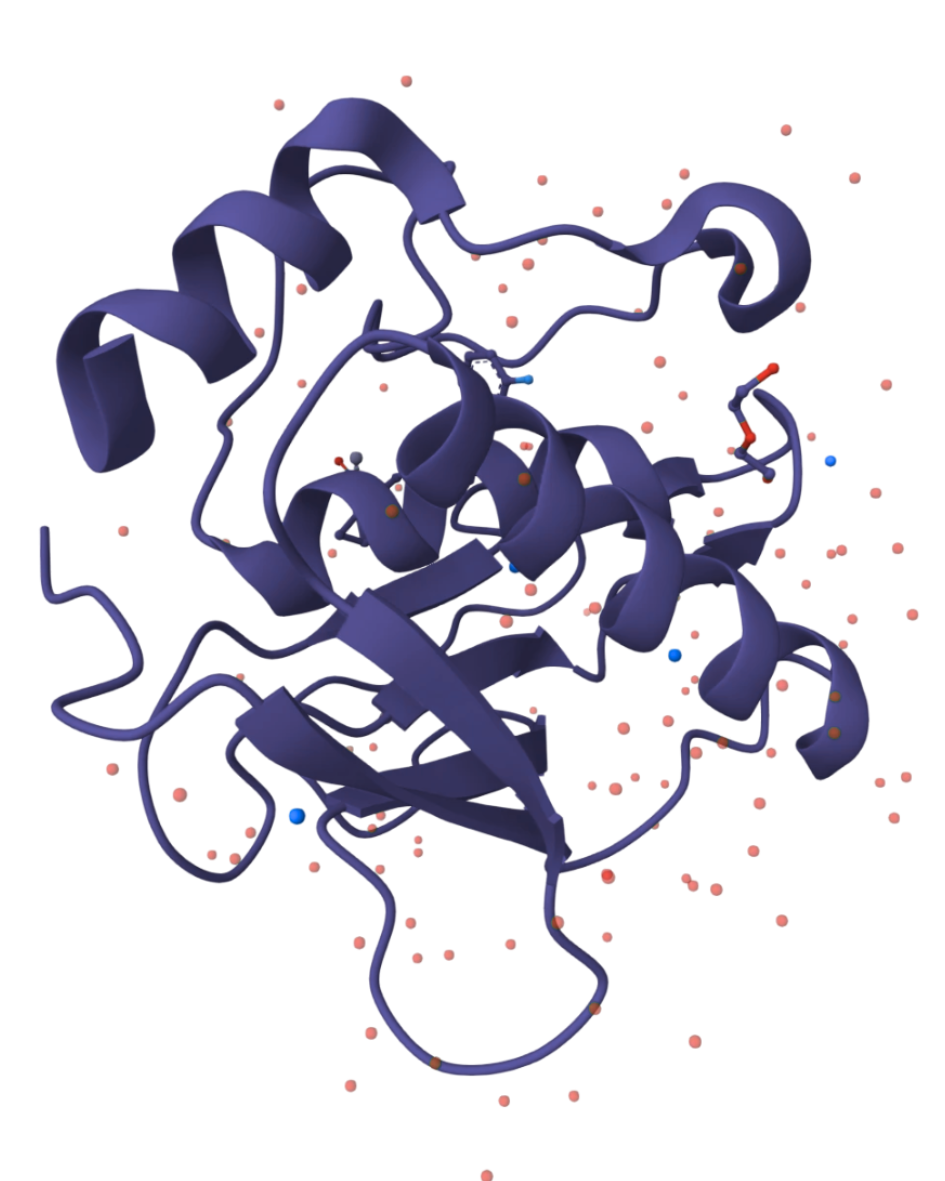
Graph-based alignment and integration of heterogeneous biological layers – enabling cross-modality feature linking (gene → protein → pathway → phenotype).
Automated Reporting & Insight Dashboards
Real-time dashboards for omics insights, experimental interpretation, and decision-making – eliminating manual report generation and Excel-based workflows.
Scientific Data Infrastructure

Compliant (HIPAA/GDPR), secure, scalable infrastructure for multi-omics workflows — including ELN/LIMS integration, automated data marts, and audit-ready lineage.
Key
R&D Challenges We Address
From fragmented omics datasets to unified biology
-
Teams waste weeks merging FASTQs, proteomics tables, assay outputs, and messy spreadsheets.
We automate the entire flow – from raw files to analysis-ready datasets
Reducing manual bioinformatics burden
-
Ad-hoc scripts and manual QC slow down R&D by 5–10×.
Our pipelines ensure reproducibility, stability, and compliance.
Accelerating biomarker and target discovery
-
AI surfaces cross-modality signals that humans miss.
Speeding early-stage hypothesis generation and validation
Ensuring data integrity across growing R&D operations
-
When data volume scales, scientific reliability collapses without structured infrastructure.
We build systems that maintain traceability, quality, and version control
Improving decision-making across complex biological programs
-
Multi-omics dashboards give teams real-time insights.
Instead of waiting weeks for analysis reports
Scaling research without scaling human labor
-
As pipelines grow, manually curating and reading data becomes impossible
Continuous ingestion + automated evidence mapping = scalable research ops
Didn’t find exactly what you were looking for?
Tell us what you’re building – we’ll map out the options, evaluate feasibility, and recommend the optimal technical pathway.
Get a consultationBiotech
Industry
USA
Location
AI Ops & MLOps, Cloud Architecture, UI/UX Design
Services
$200,000 to $999,999
Budget
The team surpassed expectations on timelines, provided much needed guidance and overall input on design, all while operating with a high degree of autonomy.

Carl Kaub
Vice President of Chemistry at HTG Molecular DiagnosticBusiness Impact You Can Expect
Book Strategy Call70%
Faster Multi-Omics ProcessingAutomated pipelines compress analysis cycles from weeks to days.
10×
Larger Analytical Search SpaceAI models connect signals across billions of multi-layered biological features.
>95%
Reproducibility in Data ProcessingFully versioned workflows eliminate variability and “script drift”.
5×
Faster Biomarker & Target DiscoveryAI models surface hypotheses early, accelerating decision-making.
Let’s build your AI advantage
Whether you’re prototyping a molecule scoring system or looking to automate your clinical ops – we’ll help you turn your biotech data into competitive edge.
Book a Meeting